Probablity Distributions
Probablity Distributions in Pandas
# import pandas and numpy
import pandas as pd
import numpy as np
# numpy has some built-in distributions
# Let's do trial one time & see the output
np.random.binomial(1,0.5)
1
# now let's do it 1000 times and find the average
np.random.binomial(1000,0.5)/1000
0.493
# let's find our probablity of occuring tornado two days in a row using binomial distribution
chance_of_tornado = 0.01 # probablity of tornado on any day

tornado_events = np.random.binomial(1, chance_of_tornado, 1000000) # trail size is set 10000000

# find consecutative two ones in return list tornado_events
two_days_in_a_row = 0
for j in range(1,len(tornado_events)-1):
    if tornado_events[j]==1 and tornado_events[j-1]==1:
        two_days_in_a_row+=1

print('{} tornadoes back to back in {} years'.format(two_days_in_a_row, 1000000/365))
102 tornadoes back to back in 2739.72602739726 years
# uniform distribution
np.random.uniform(0, 1)
0.2962707472170836
# uniform distribution with lower upper bound
np.random.uniform(0, .75)
0.14042166159994887
Formula for standard deviation $$\sqrt{\frac{1}{N} \sum_{i=1}^N (x_i - \overline{x})^2}$$
# normal distribution
distribution = np.random.normal(0.75,size=1000)

# calculating standard distribution from formula
np.sqrt(np.sum((np.mean(distribution)-distribution)**2)/len(distribution))
0.96359223265251603
# calculating with inbuilt function
np.std(distribution)
0.96359223265251603
import scipy.stats as stats
stats.kurtosis(distribution)
0.0886272943714217
# finding skew of distribution
stats.skew(distribution)
-0.12279299911663993
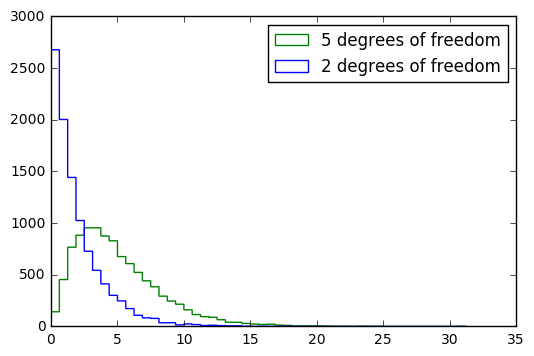
# let's see how skew varies in case of chi squared distribution if degree of freedom is changed
# skew for degree of freedom 2
chi_squared_df2 = np.random.chisquare(2, size=10000)
stats.skew(chi_squared_df2)
2.110549699727957
# skew for degree of freedom 5
chi_squared_df5 = np.random.chisquare(5, size=10000)
stats.skew(chi_squared_df5)
1.1764301229675125
%matplotlib inline
import matplotlib
import matplotlib.pyplot as plt

output = plt.hist([chi_squared_df2,chi_squared_df5], bins=50, histtype='step',
                  label=['2 degrees of freedom','5 degrees of freedom'])
plt.legend(loc='upper right')